
This document explains how to show capacity in your Signage display. The Capacity Times object lets you pick an area or areas from your database and display timeslot and capacity information for it in the form of a table. The headers, background, fonts, and other visual elements are all customizable. For a more general introduction to Signage, see Signage Overview.
- From Signage Editor, right click the Screens folder.

- Select New Screen.
- Enter a Screen Name.
- From the Toolbox, drag and drop Capacity Times onto the canvas.
- Stretch the object to your preferred size.
- Open the Properties tab of the toolbox.

- Expand the Brushes section.
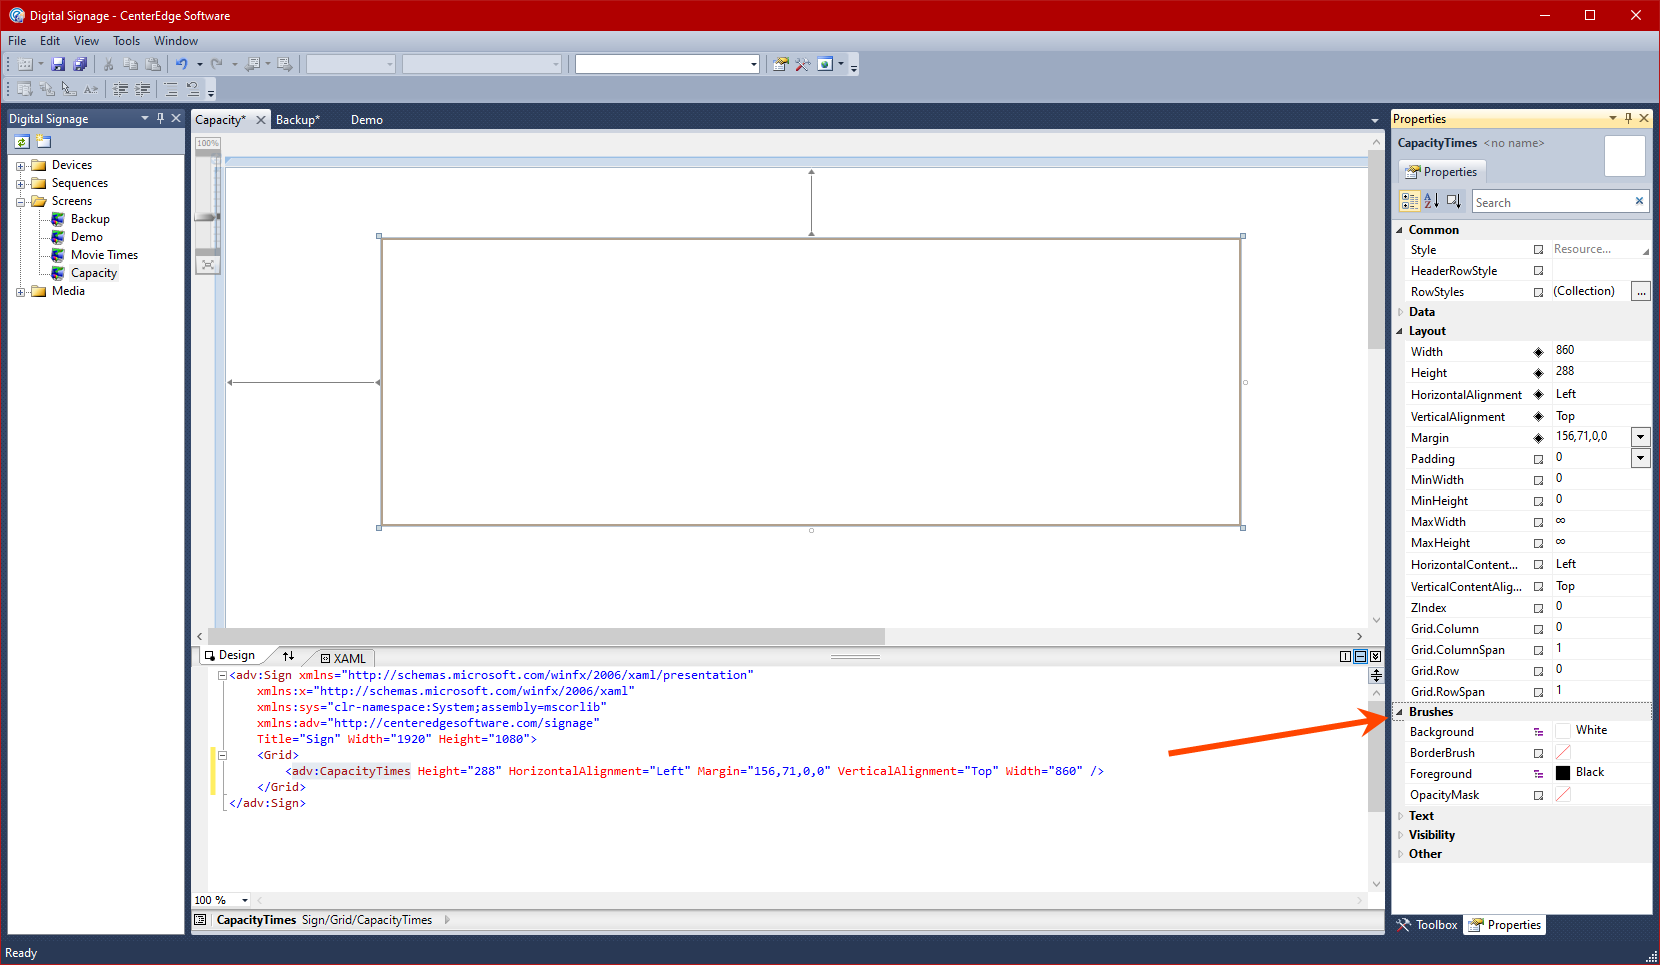
- Configure the background and text color (Foreground) of the object as necessary.
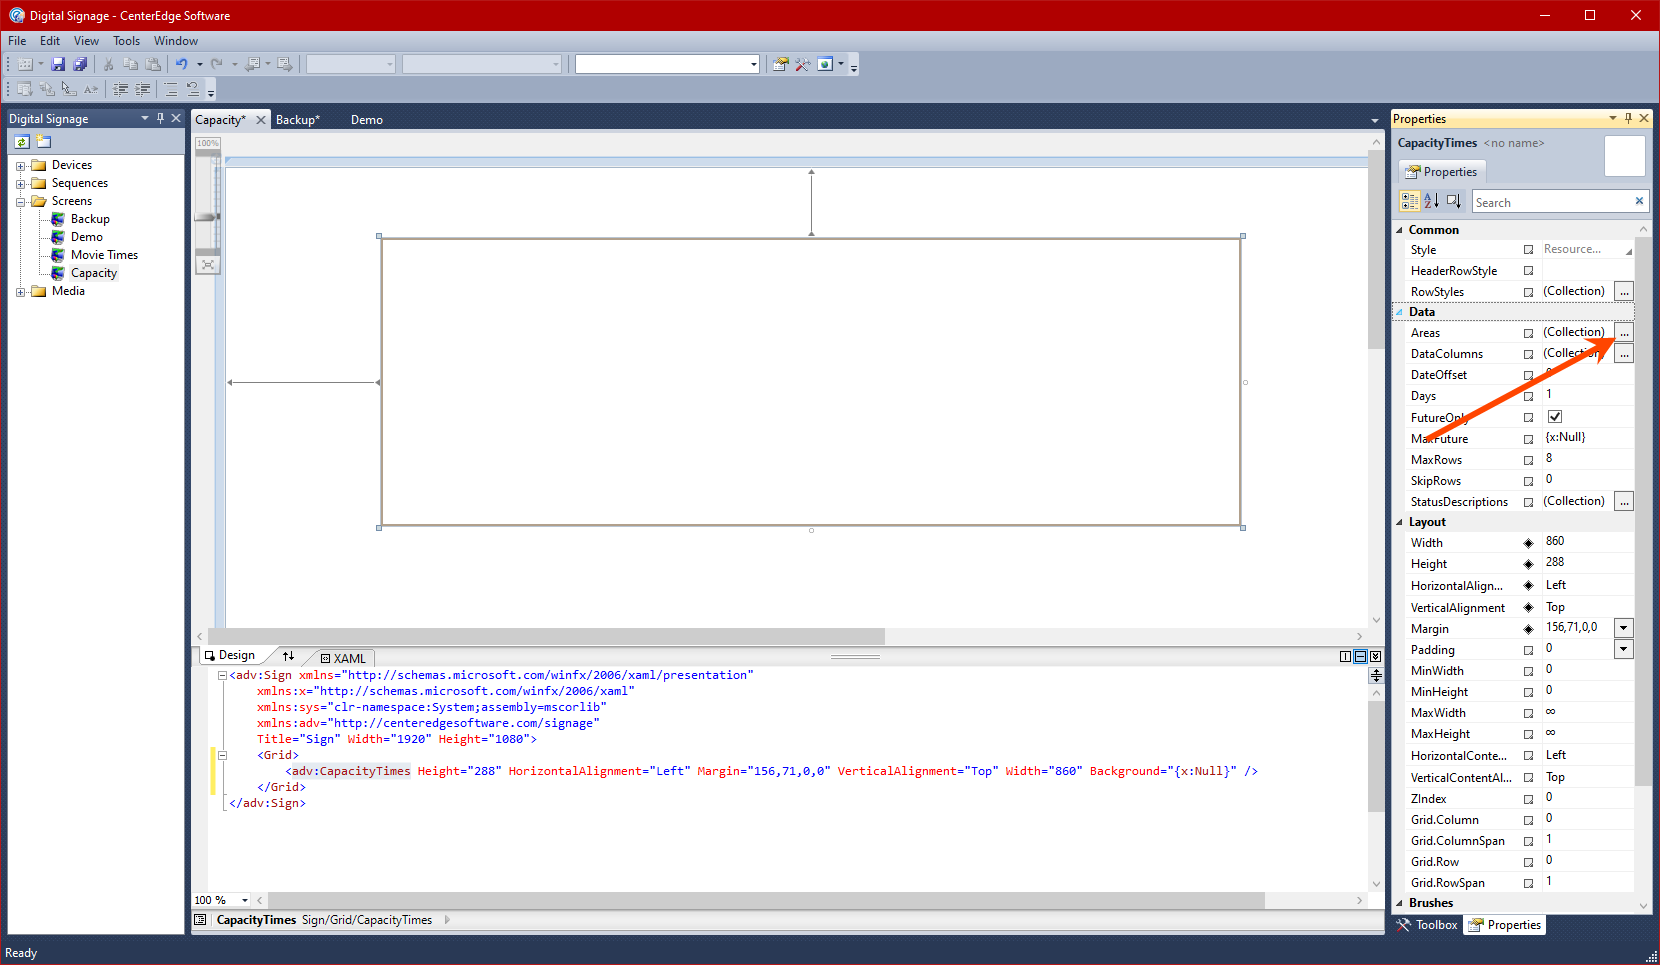
- Expand the Data section.
- Click the ellipses next to Areas.
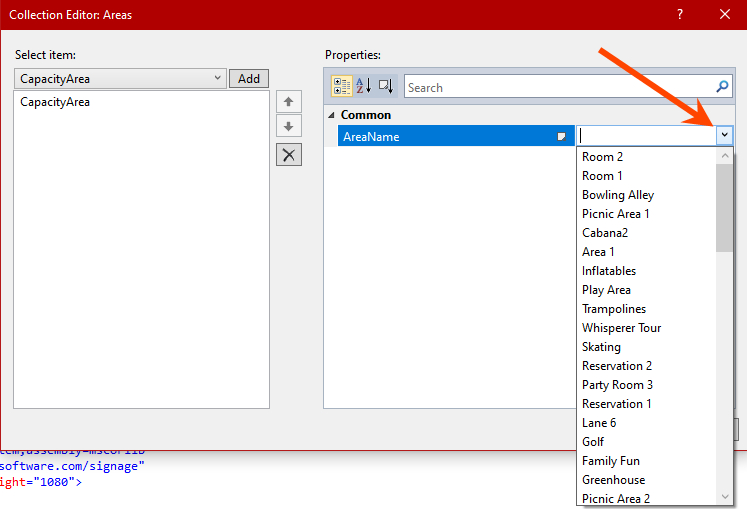
- Click Add to select an area from which to pull capacity numbers.
- Select an area from the AreaName pull-down list.
- If you don't select one, it will use all areas.
- If you don't select one, it will use all areas.
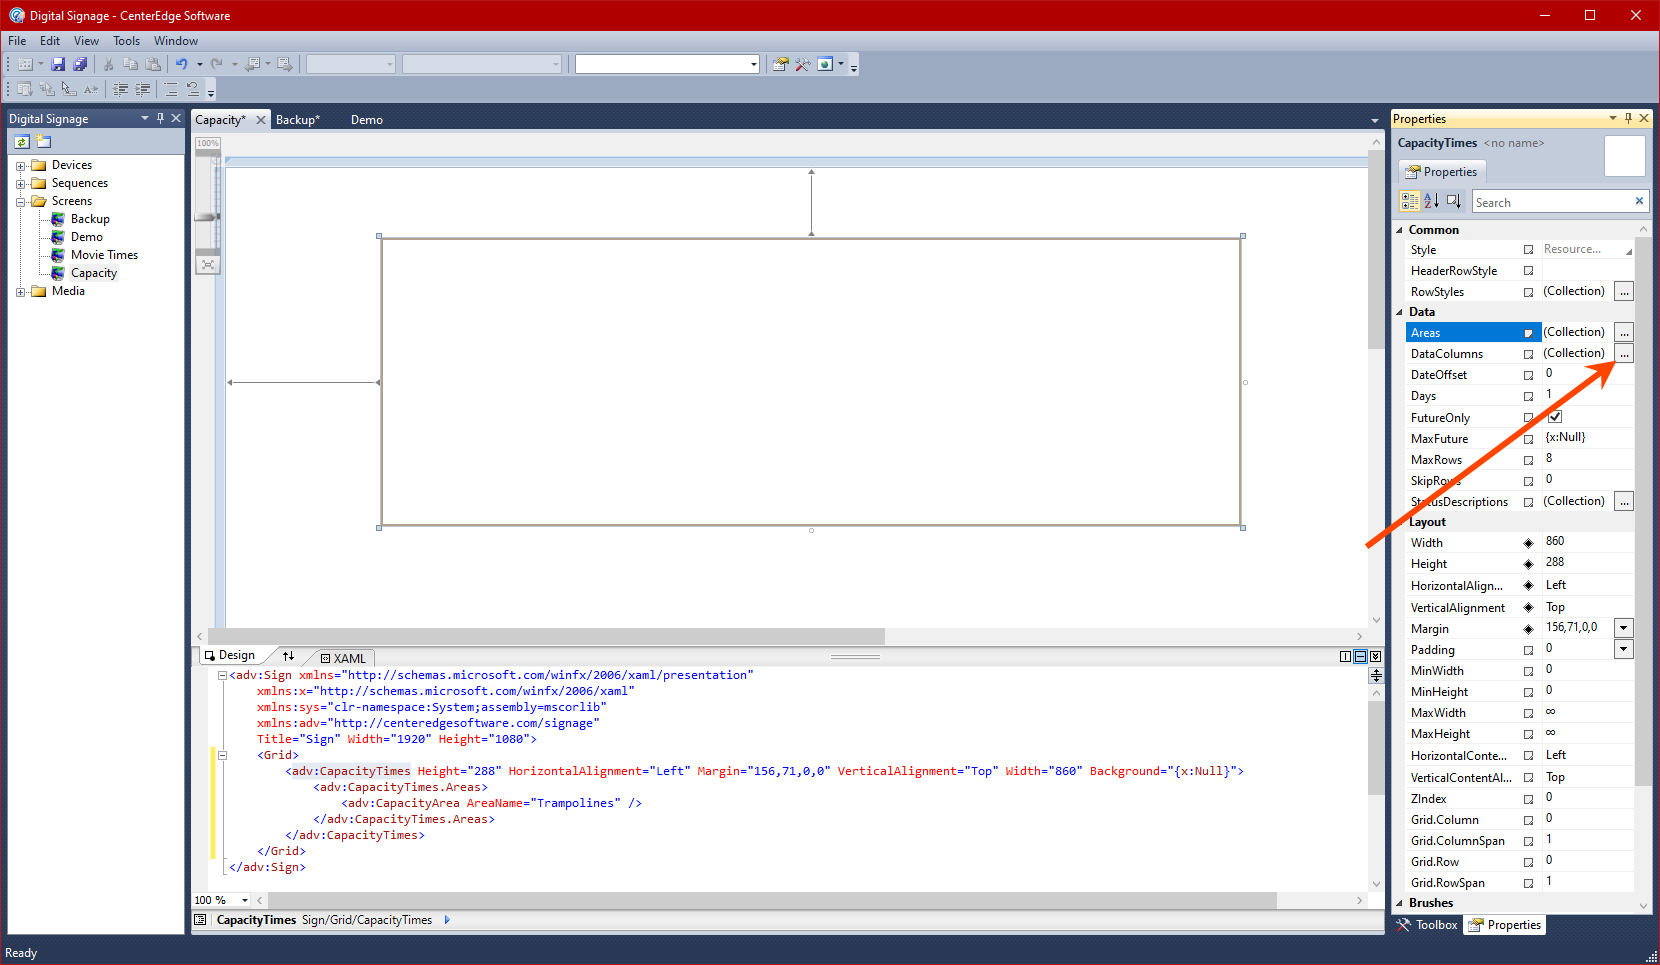
- Add any additional areas as necessary.
- Click OK.
- Click the ellipses next to DataColumns.
- Click Add to create the first column of data.
- Select a ColumnName from the pull-down list, which determines what information populates in the column.

- StartTimeText and EndTimeText will format the text with a standard time, while StartTime and EndTime allow you to make more custom outputs for timeslots.
- Sold shows the number of tickets sold.
- Capacity shows the total capacity.
- Available shows the number of capacity slots remaining.
- Status allows you to add custom text, which you can later configure to display depending on settings in relation to your timeslots.
- If necessary, add Header text to title the column, such as "Activity Times."
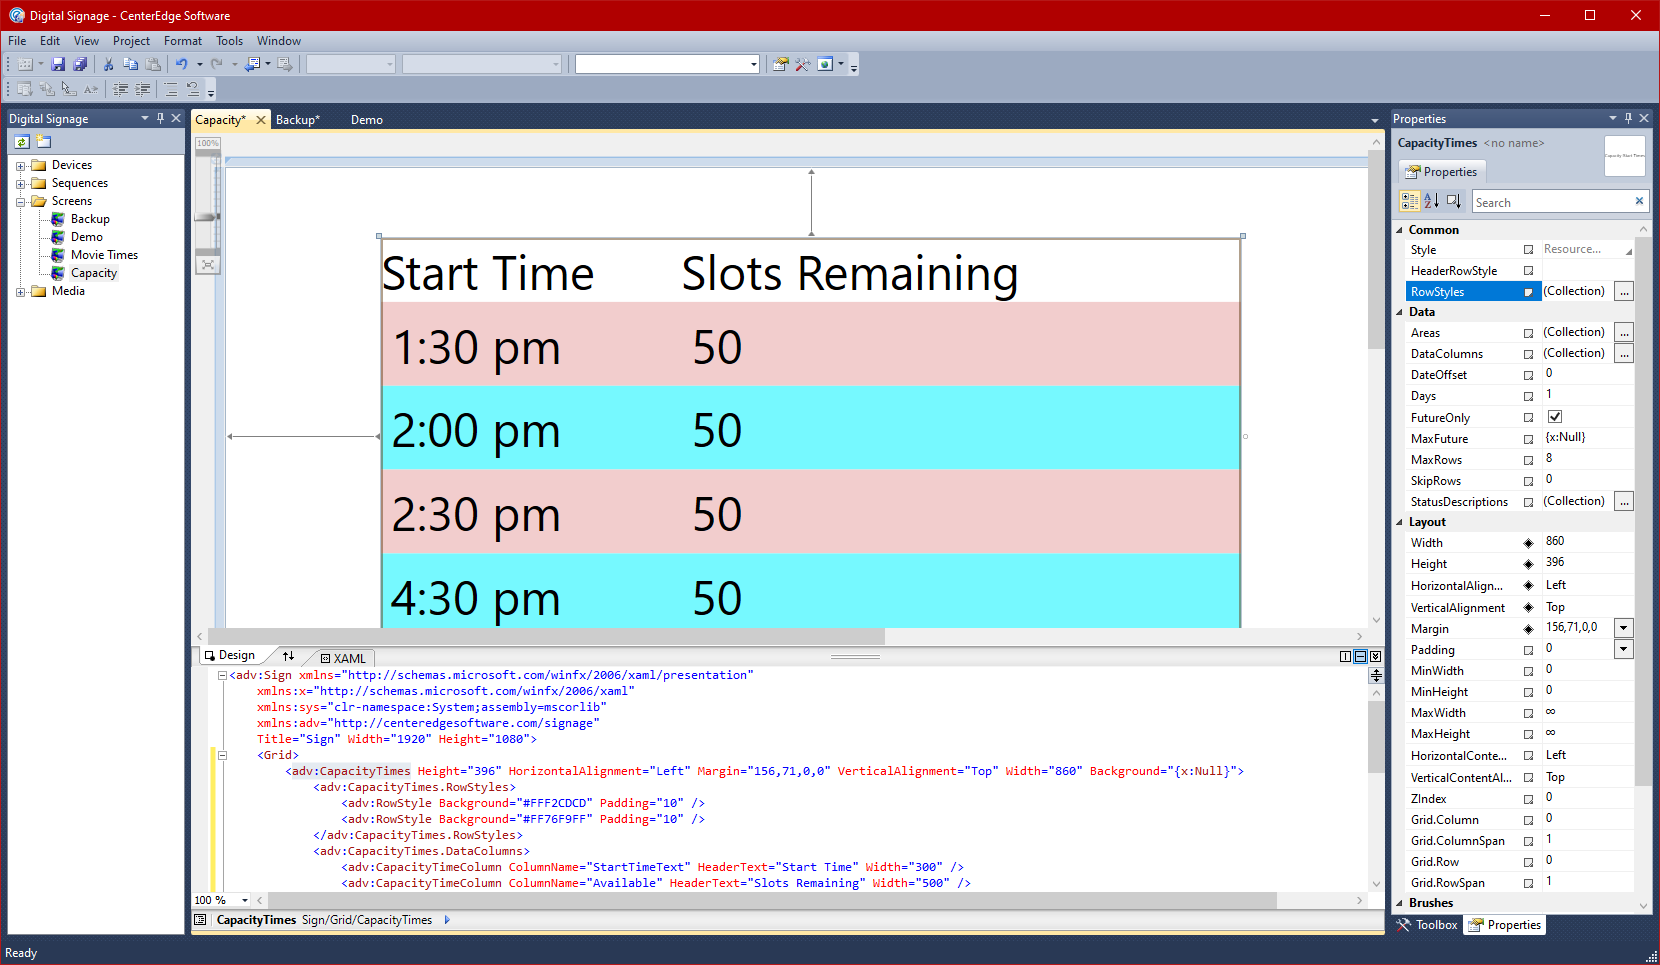
- Alter the column width, background, and alignment as needed.
You can see the layout update in the background as you change the fields to preview how the final product will look.
- Add any other columns of data you want to display.
- Click OK.
- If you are using a Status column, click the ellipses next to StatusDescriptions.

- Click Add.
- Enter the text to display in Description, such as "In Progress" to complete status setup.
- To determine which days to display data from, enter a negative number in TimeOffset to to begin to display days that many days in the past onward, enter a positive number to begin that many days in the future, and 0 to begin with the current day.
- Click OK.
- Set DateOffset to a positive number to show information beginning on days in the future, a negative to start on past days, and 0 to begin today.

- Enter a number in Days to set the number of days to display, which will be calculated relative to the DateOffset you selected.
- For example, if you wanted to show slots for yesterday, today, and tomorrow you would enter 3 here and -1 into the DateOffset field.

- For example, if you wanted to show slots for yesterday, today, and tomorrow you would enter 3 here and -1 into the DateOffset field.
- Select the FutureOnly check box to only show information for activities that have not yet occurred.

- Enter a time in MaxFuture to only show activities less than that amount of time into the future.

- Enter a number into MaxRows to determine the maximum number of rows to display.

- To skip showing a certain number of rows, enter a value in SkipRows
- This may be used to split the rows displayed on separate Screens. Enter a certain number of rows in MaxRows on one screen, and enter that same number into SkipRows for the other.

- This may be used to split the rows displayed on separate Screens. Enter a certain number of rows in MaxRows on one screen, and enter that same number into SkipRows for the other.
- To change the font, expand the Text section and alter the fields as necessary.
Verify any fonts you use are installed on the signage computer.

- Expand the Other section.

- Enter a negative TimeOffset to display any activities that have happened already within that time range and a positive number to skip to those activities that occur after that time range.
- Expand the Common section.
- Click the ellipses beside RowStyles if you want to alter the look of the rows.
- Click Add.
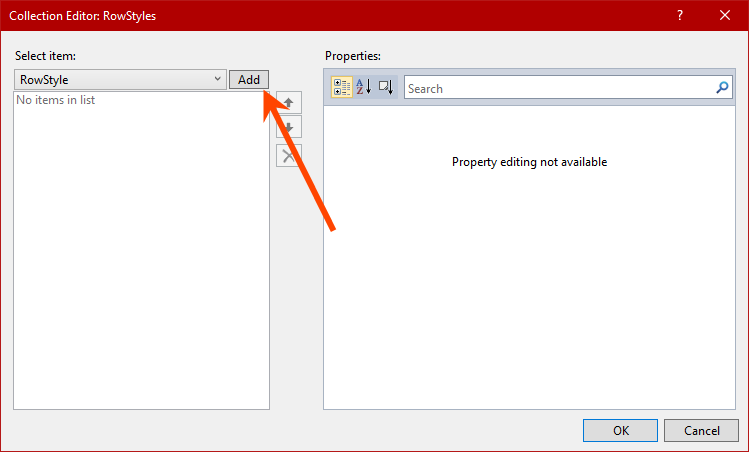
- Change the background, border, corner radius, and layout as necessary.
- Add additional row styles as necessary.
- The row styles will cycle through in order. For example, if there are two row styles, the appearance of the rows will alternate.
- The row styles will cycle through in order. For example, if there are two row styles, the appearance of the rows will alternate.
- Complete the setup of this Screen with any other objects you want to include.
At the time of export, this article was last updated . Navigate here to see the latest version: https://support.centeredgesoftware.com/hc/en-us/articles/360014596414-Create-a-Capacity-Screen-in-Signage-Editor
Comments
0 comments
Please sign in to leave a comment.
Related articles